
01 / DRAW
110+ smart drawing tools
Mark trends, levels and patterns directly on the chart, then return to the analysis you saved.
Command the wealth
Explore Iran and crypto markets in one workspace: advanced TradingView charts, multi-chart comparison, Bar Replay, scanners, heatmaps and explainable opportunities.
Product tour
Each workspace is built for a specific decision: monitor exchange events, compare symbols, scan market behavior, map sectors, and surface higher-conviction opportunities.
Advanced Charts by TradingView
The advanced TradingView chart experience, connected to Sepertino's market workflows. Explore the actual tools and visual language behind the chart, then compare symbols and replay history in the terminal.
The advanced toolkit
Each tool supports a different step, from marking a setup to checking its behavior across symbols and time.
Mark trends, levels and patterns directly on the chart, then return to the analysis you saved.
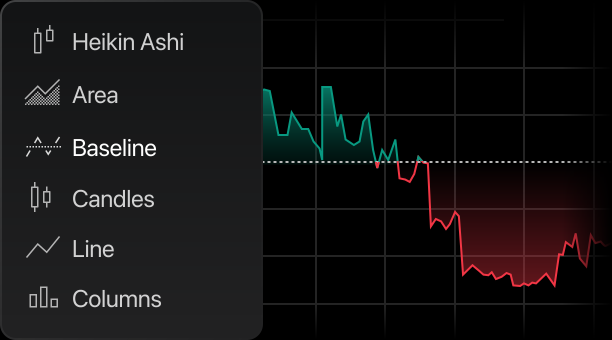
Switch the visual representation to read price action in the way that suits your analysis.
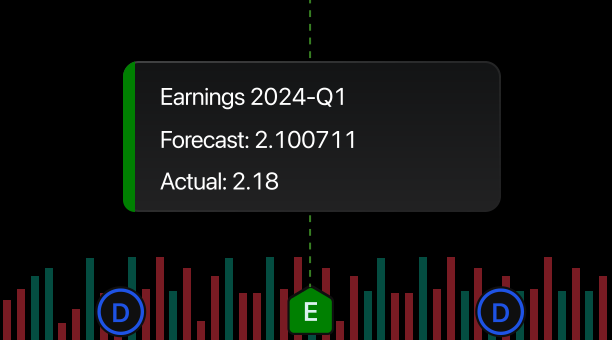
Keep important notes and context close to the bars that prompted the idea.
Add familiar studies to inspect trend, momentum and volume alongside candles.
Beyond a single chart
Two Sepertino workflows deserve a closer look: historical Bar Replay inside the detailed chart and a multi-chart board for scanning Iranian symbols.
Choose a starting candle in Sepertino's detailed chart, play historical price action, pause it, adjust speed or advance one bar. Study a setup without future candles in view.
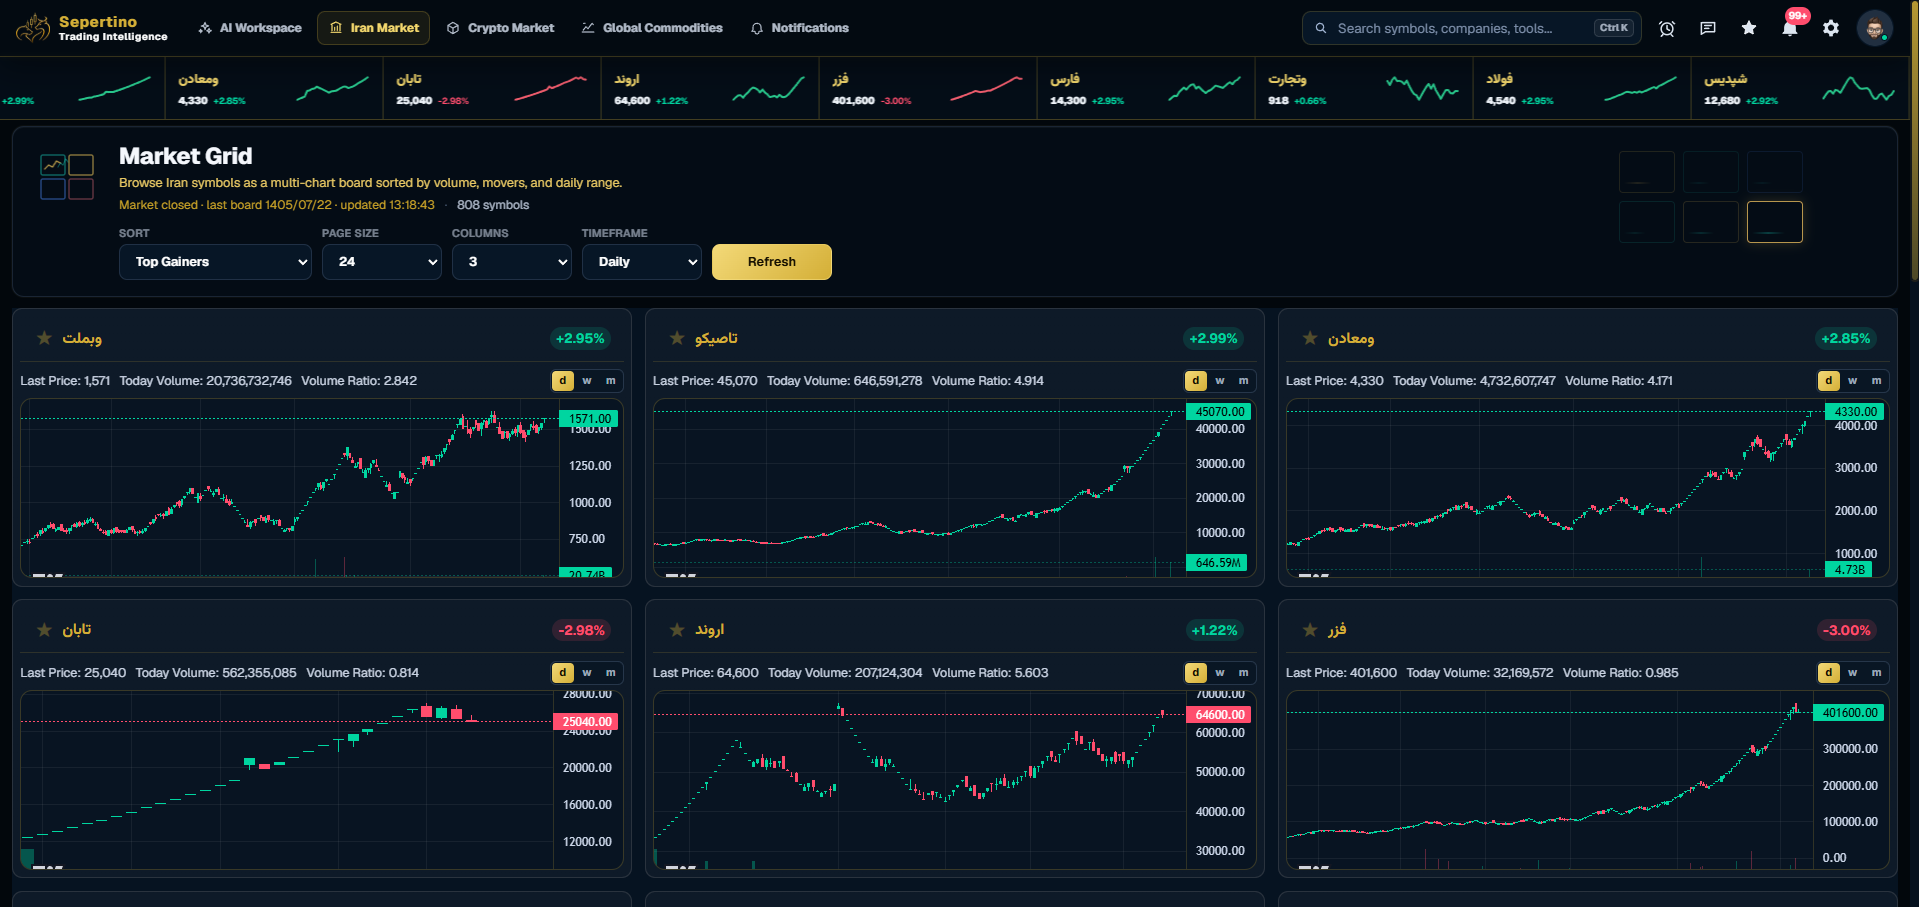
Iran Grid lays out multiple Sepertino symbol charts in one board. Sort the market by activity and movement, compare candidates visually and open a detailed TradingView chart for deeper analysis.
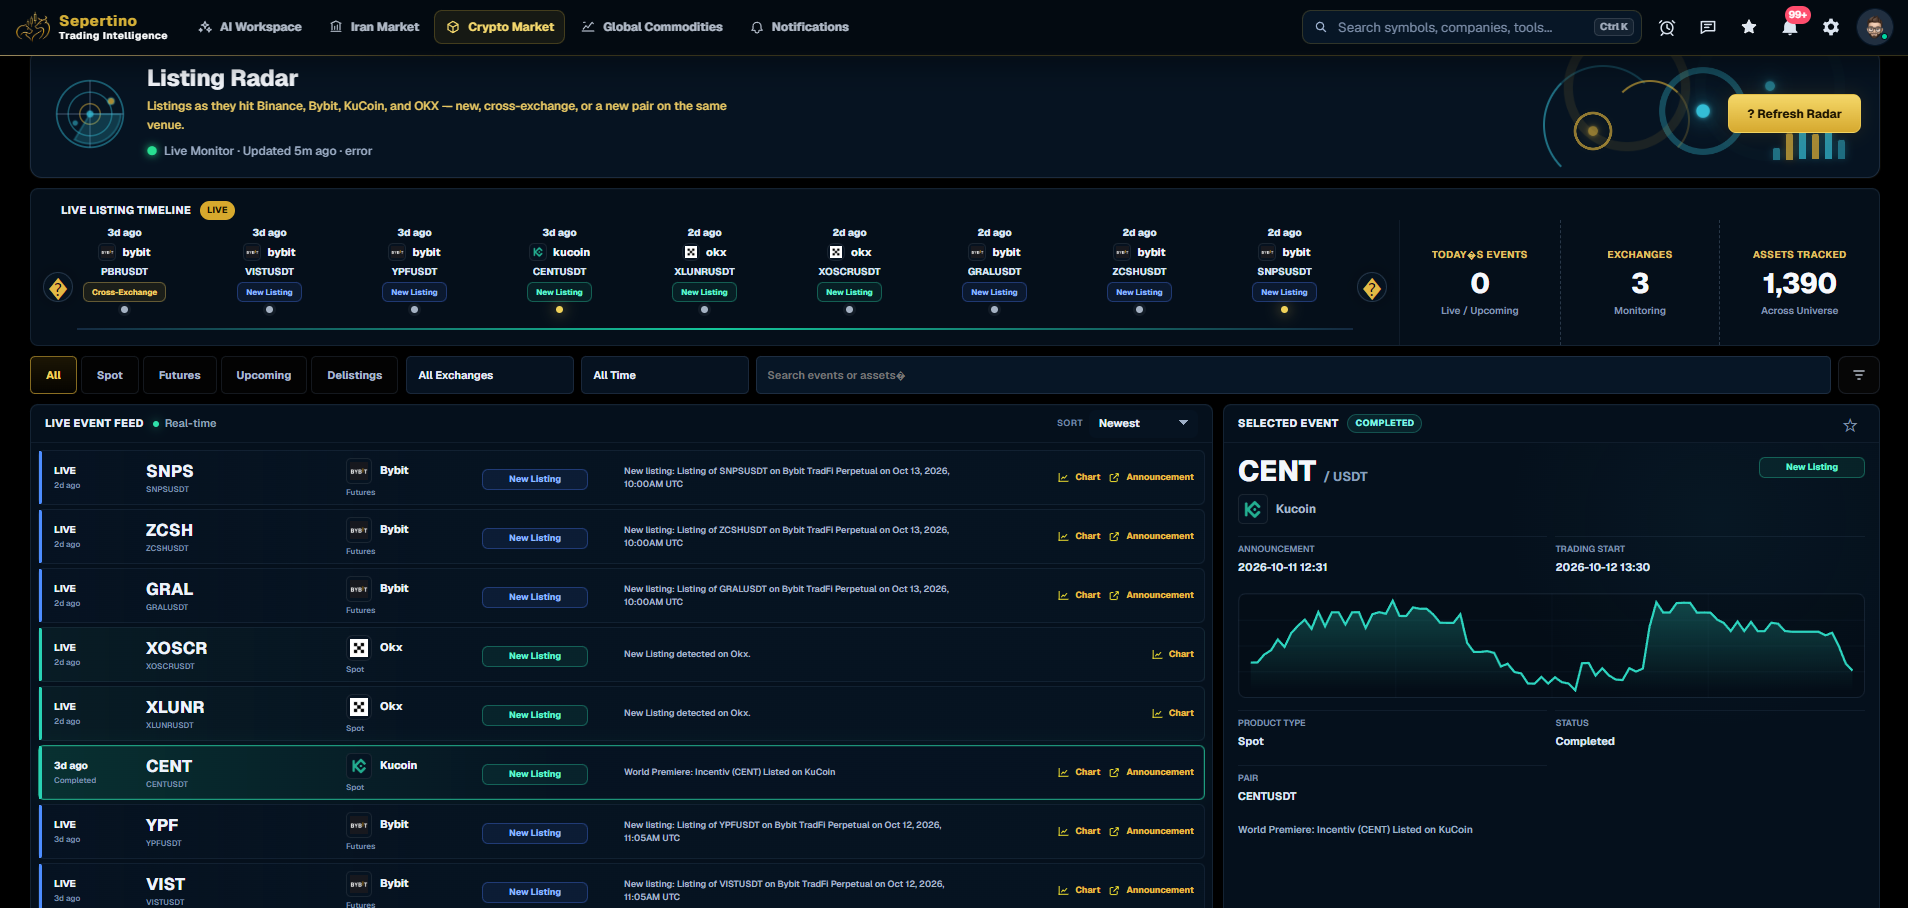
Track listings, futures launches, upcoming trading starts, and delisting candidates across supported exchanges. The event feed combines timing, status, exchange source, and asset context so new market events are immediately understandable.
A high-density multi-chart board designed for rapid visual comparison across the Iran market. Sort symbols by activity, range, or other market measures and review price action, volume, and relative movement in a single screen.
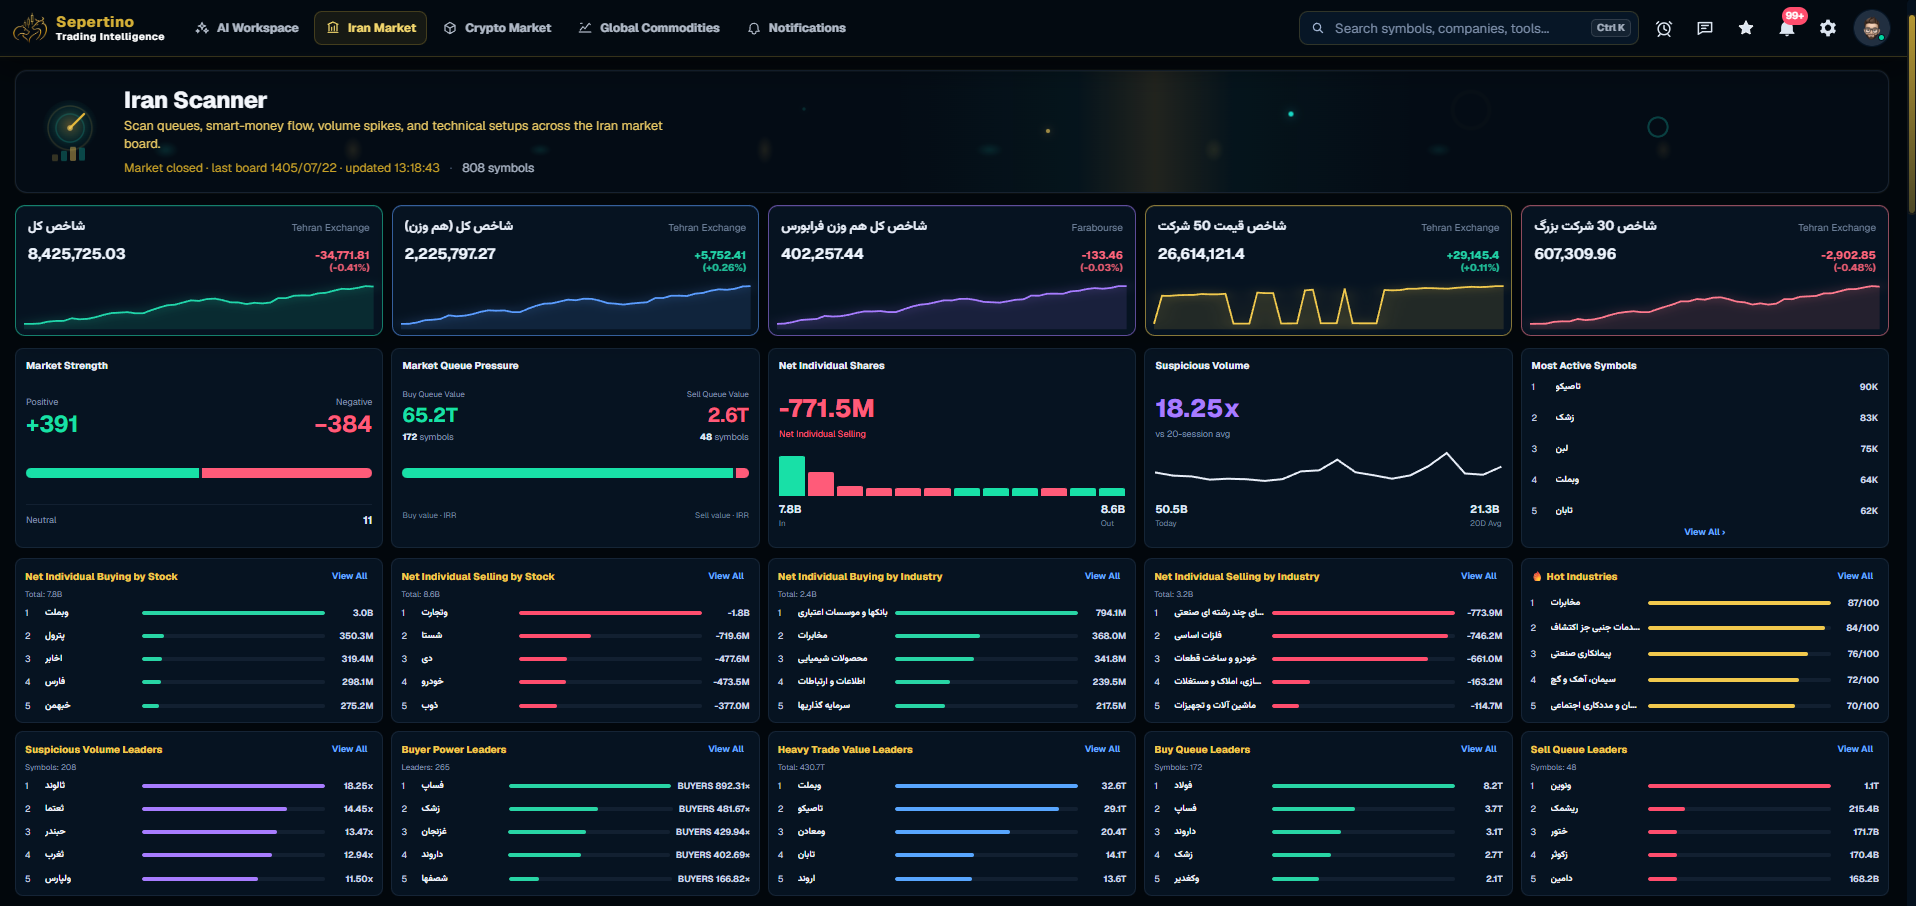
Understand the broad market before opening individual symbols. The scanner summarizes advancing and declining shares, queue balance, real-money flow, suspicious volume, active industries, and the strongest leaders across several behavioral categories.
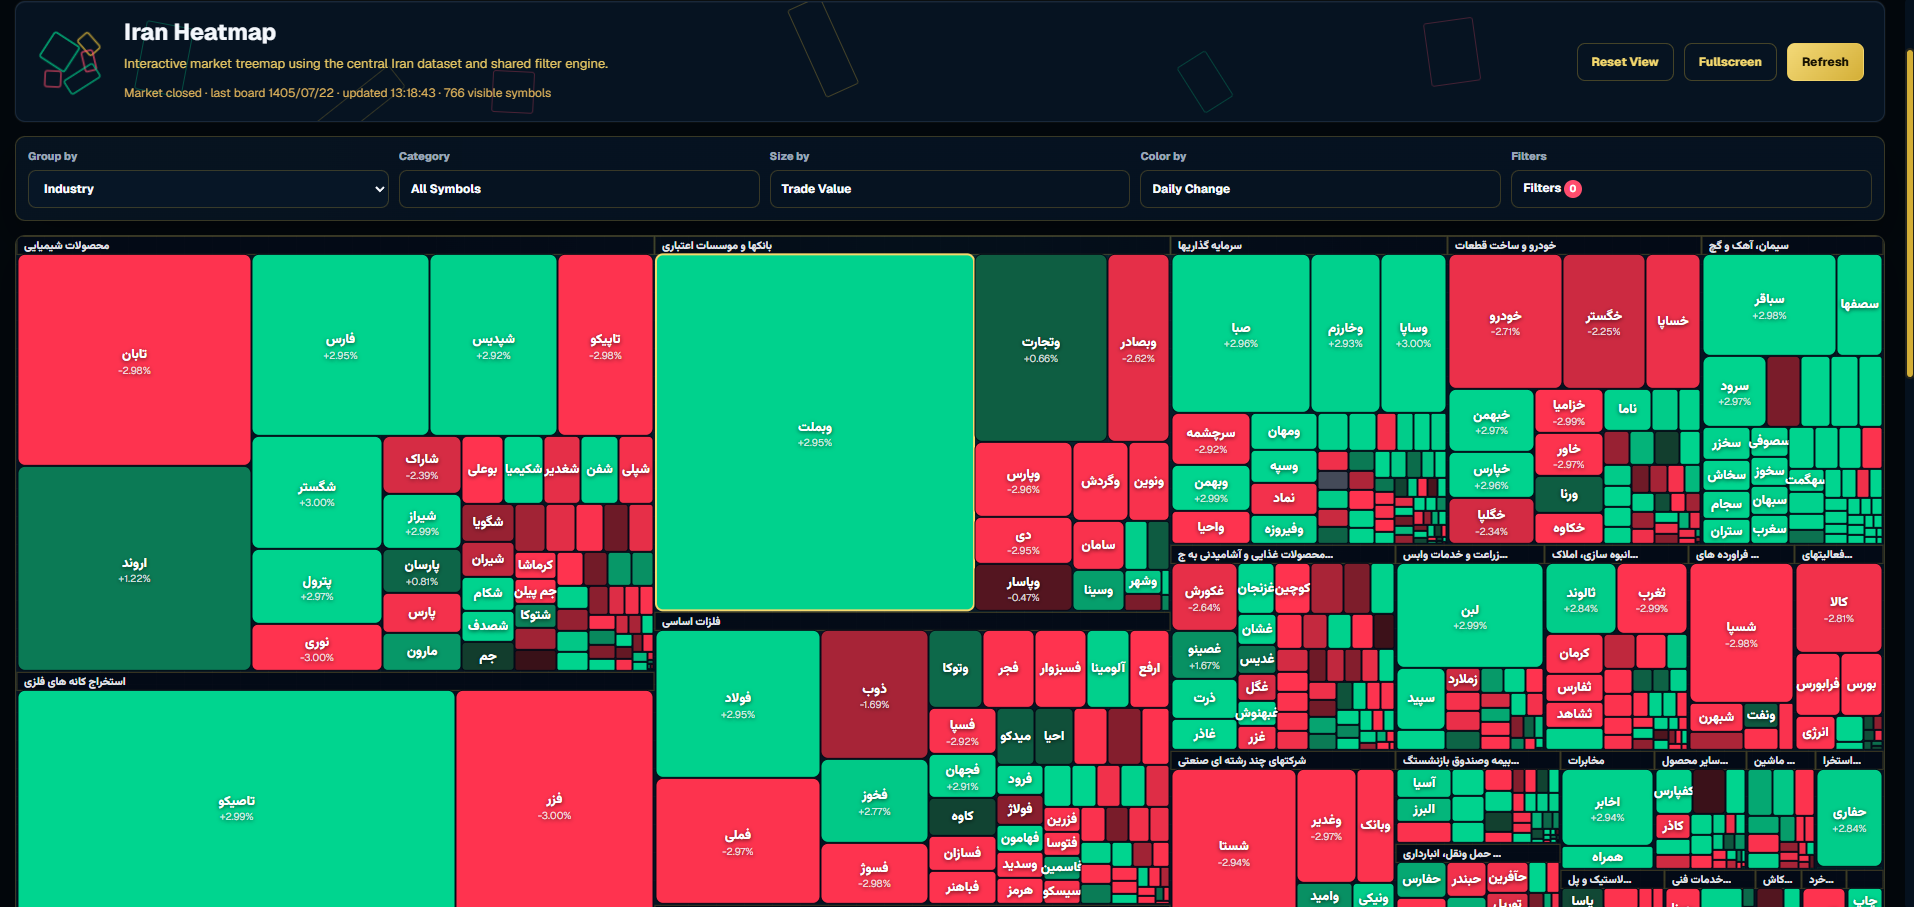
Explore the Iran market through an interactive treemap. Group symbols by industry, size them by trade value or another selected metric, color them by performance, and drill into symbol-level details without leaving the map.
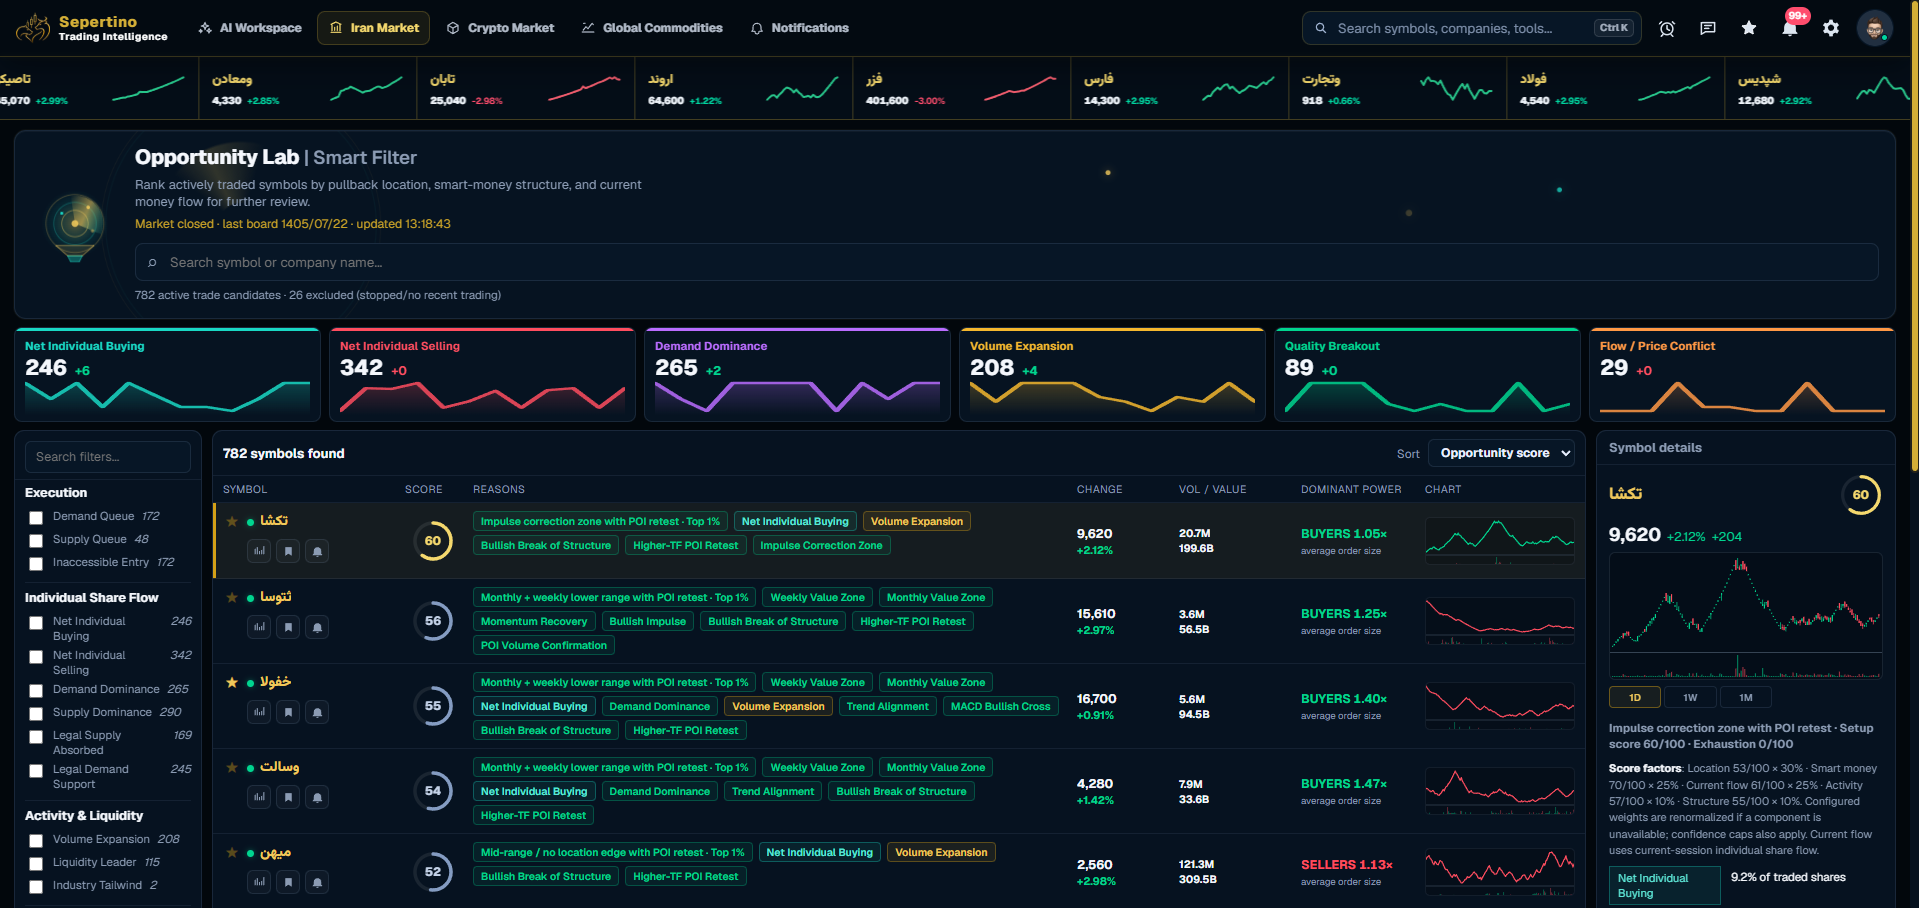
Convert a large market universe into a ranked, explainable shortlist. Opportunity Lab combines queues, smart-money flow, buyer power, volume behavior, technical conditions, and market context while showing exactly why each symbol matched.
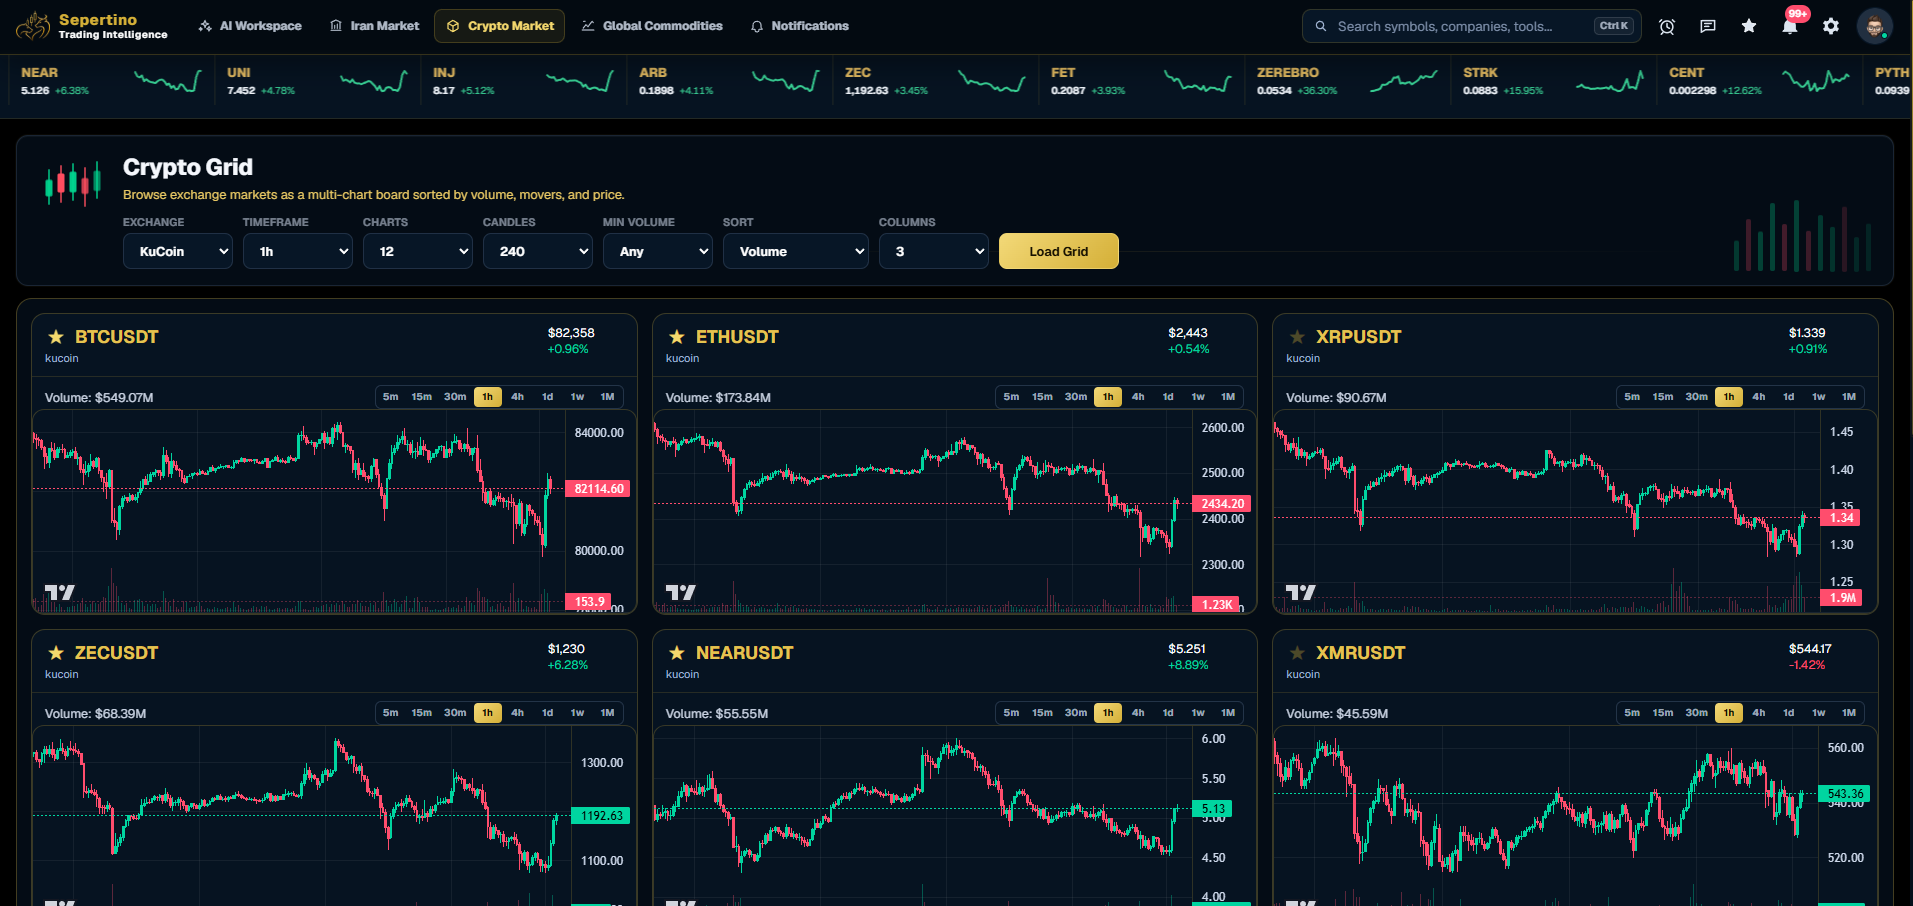
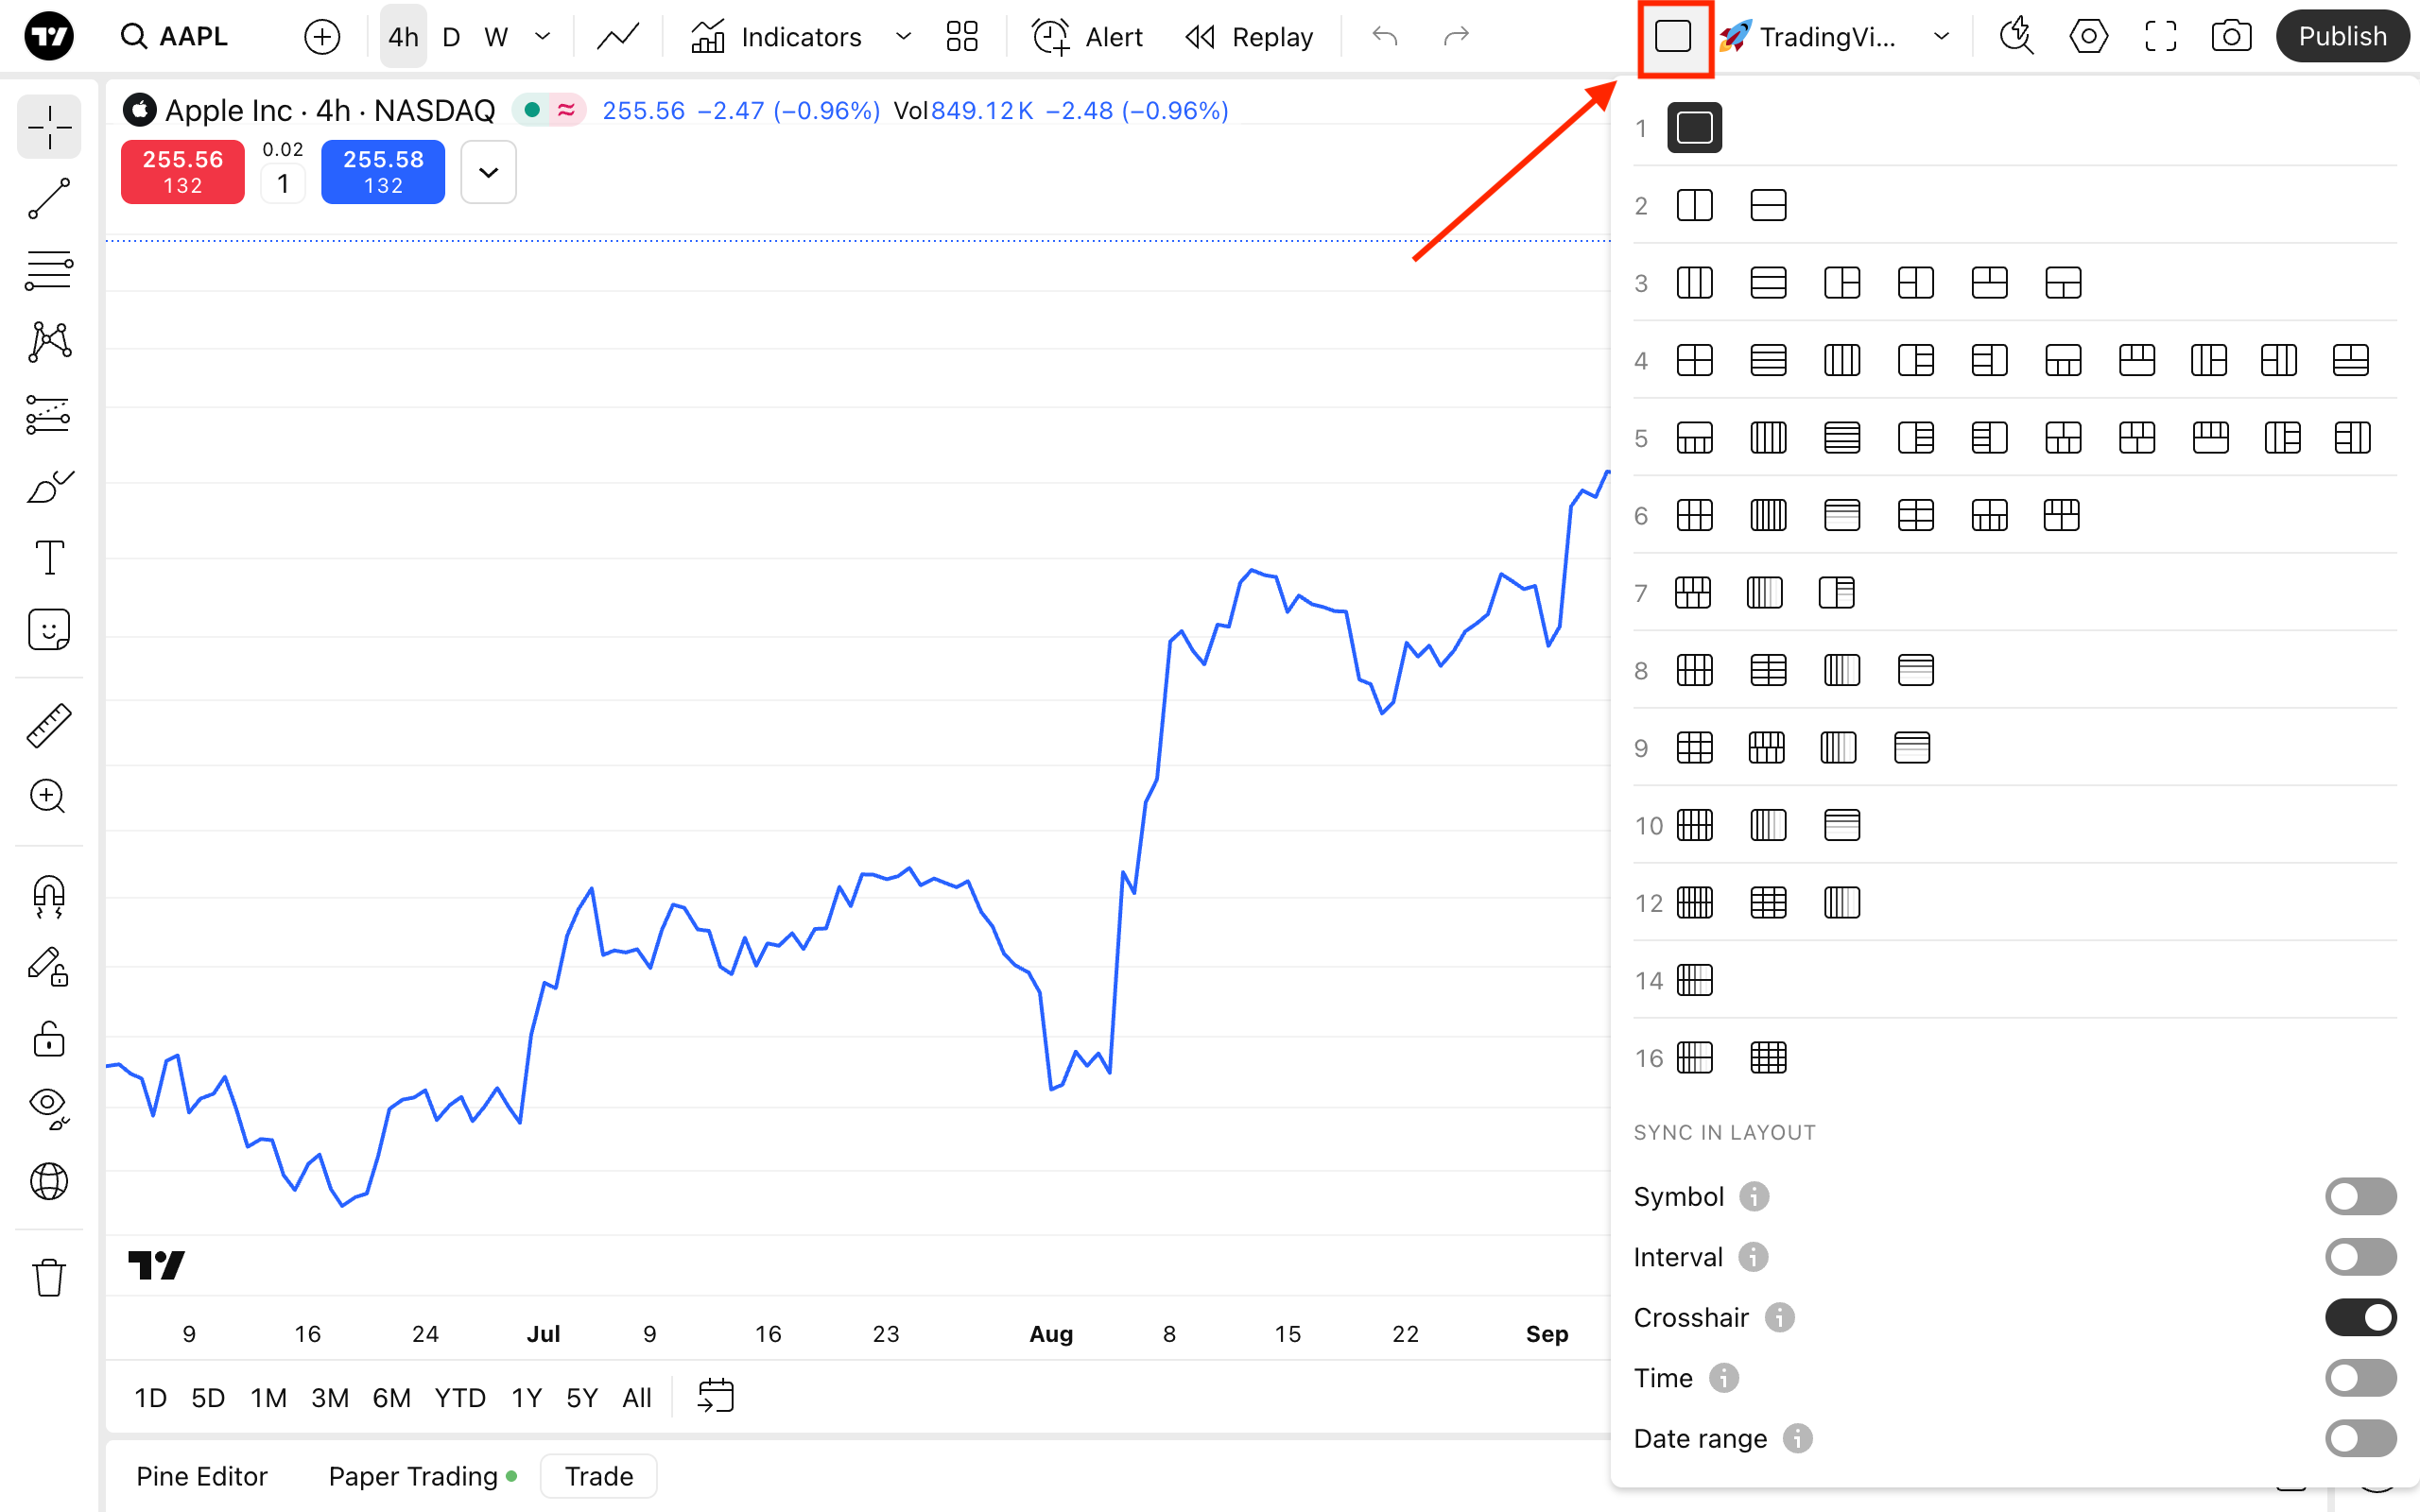
Scan exchange markets as a multi-chart board. Choose an exchange and timeframe, then sort by volume, movement or price to bring the most relevant contracts into view. The board keeps price action and volume visible together so you can compare candidates before opening a detailed chart.
07 · Global research
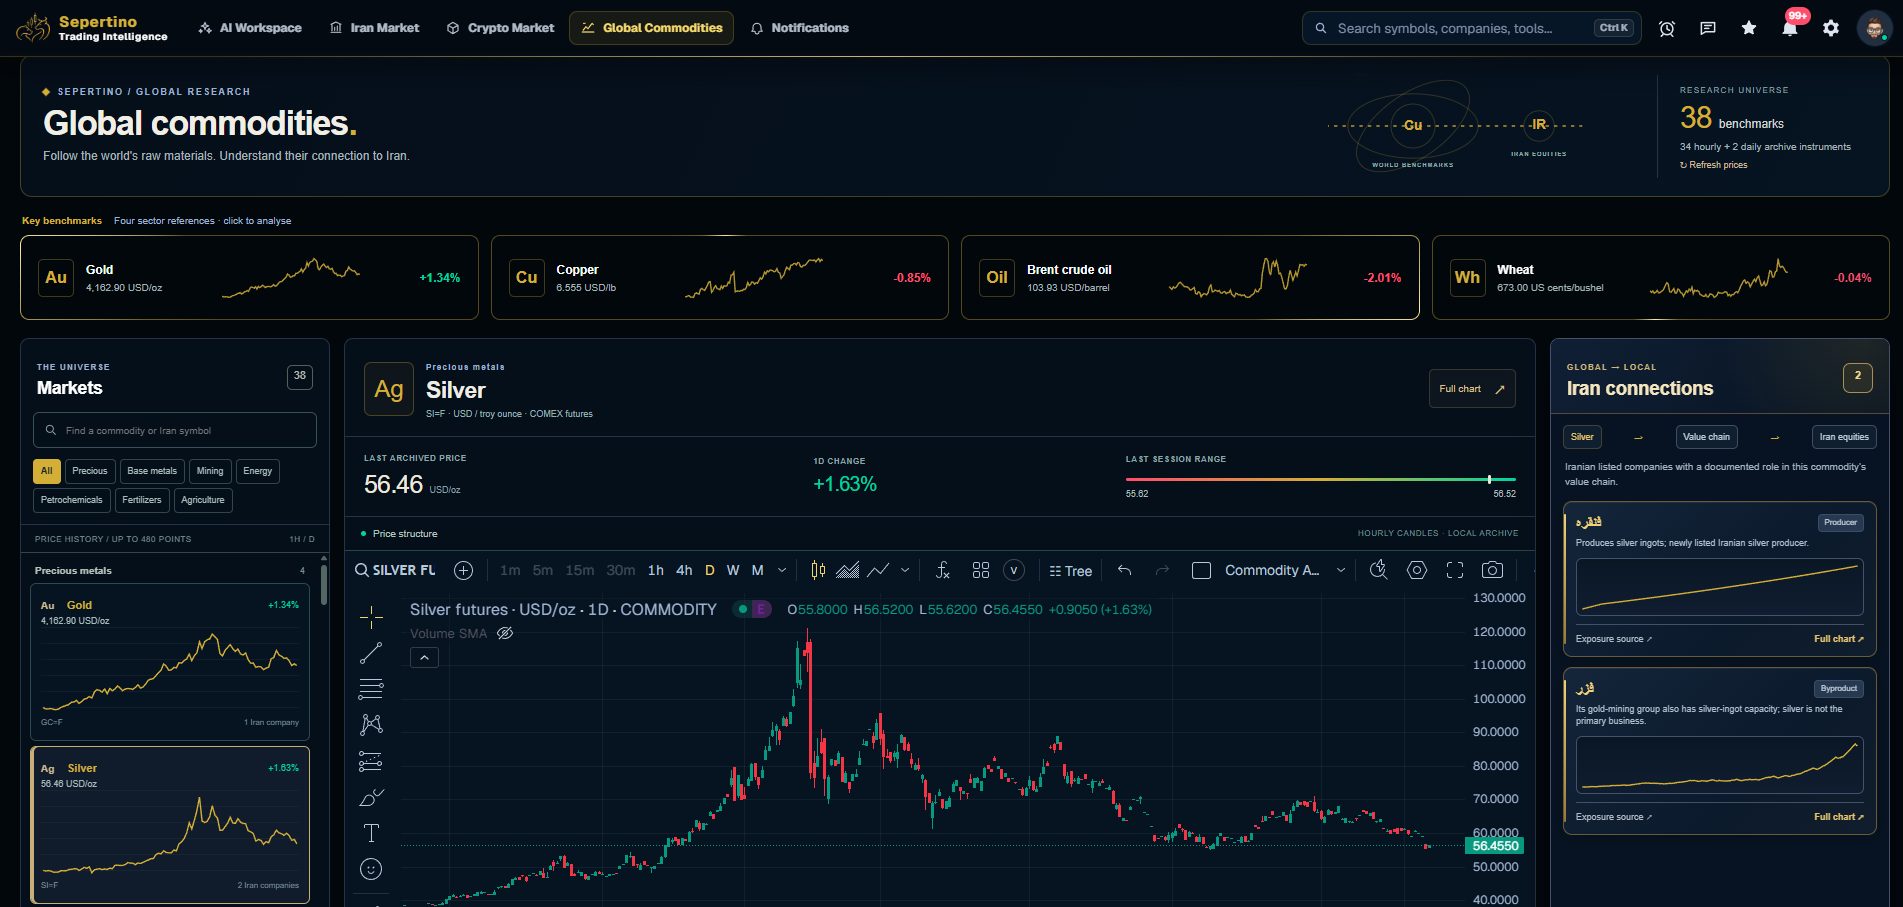
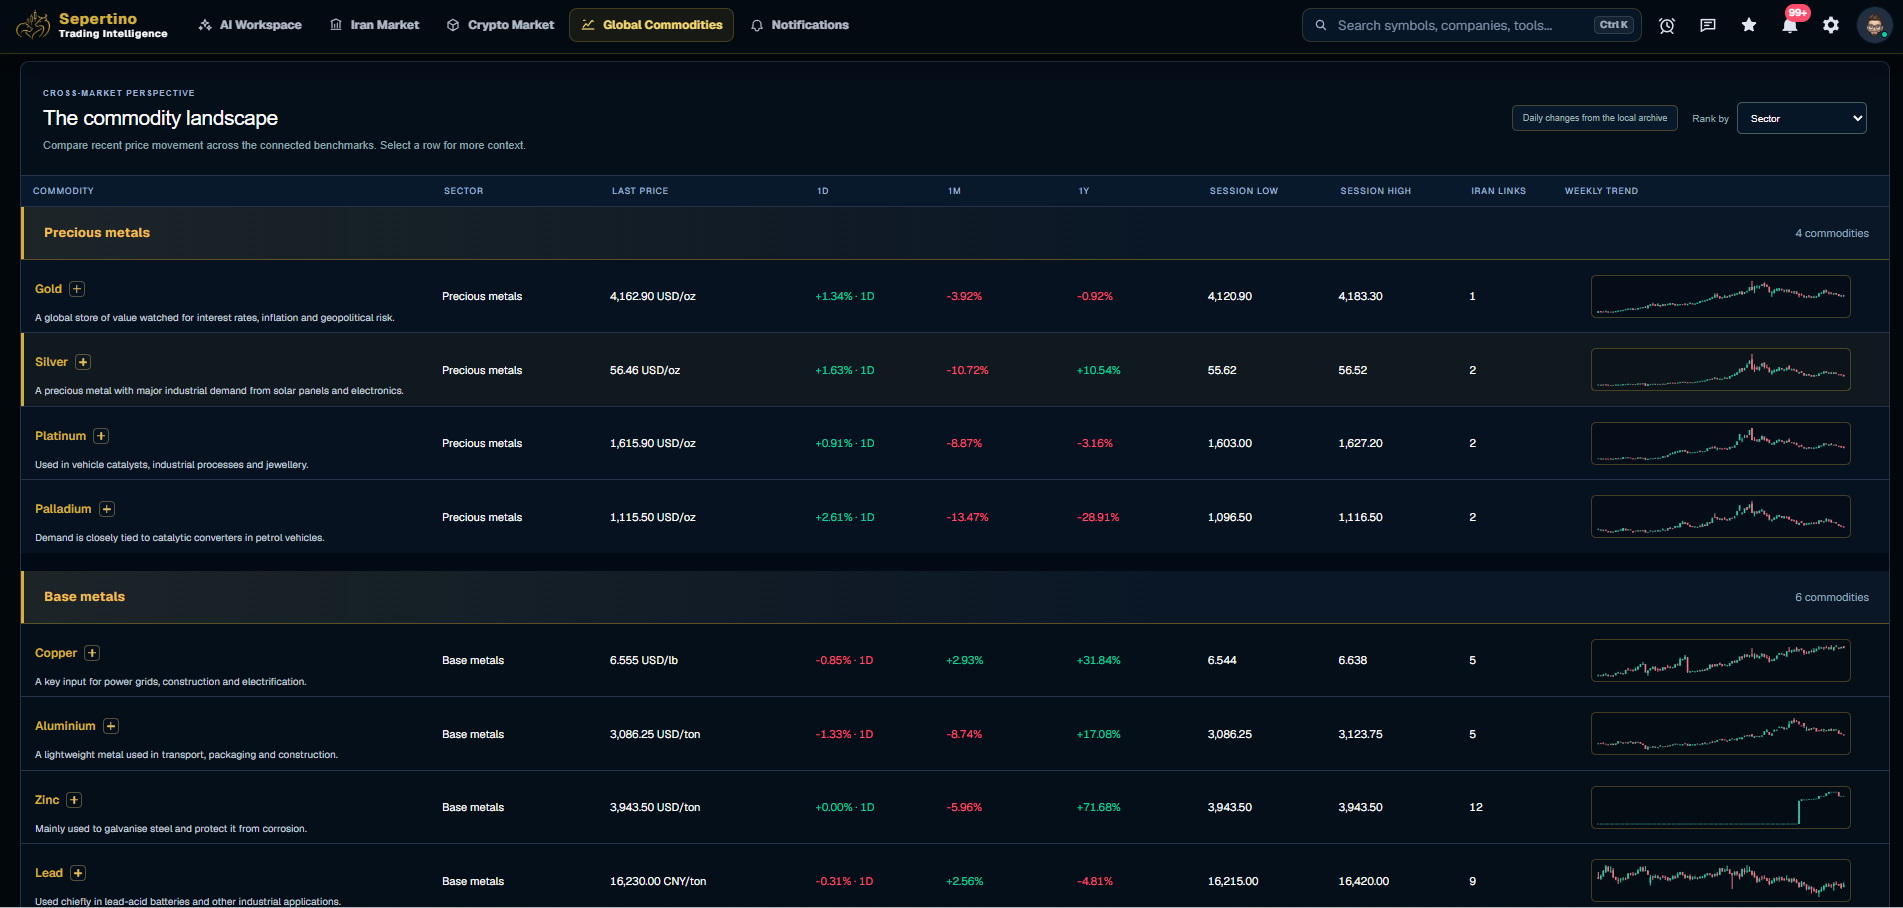
Follow major raw materials and connect global price movement to the Iran market. Browse benchmarks by sector, inspect archived price history in a full chart, and see which Iranian companies are linked to a commodity's value chain.
08 · Research workspace
Take a market question beyond a single chart. Research conversations, signal review, strategy work, paper trading and reports live in dedicated views so you can develop an idea and inspect the evidence around it.
Use the chat to frame a question, check market context and signals, then move into strategy and paper-trading views to test or review the idea. Reports keep results and provenance visible for a more careful assessment.
Illustrative workflow
09 · Perpetual futures research
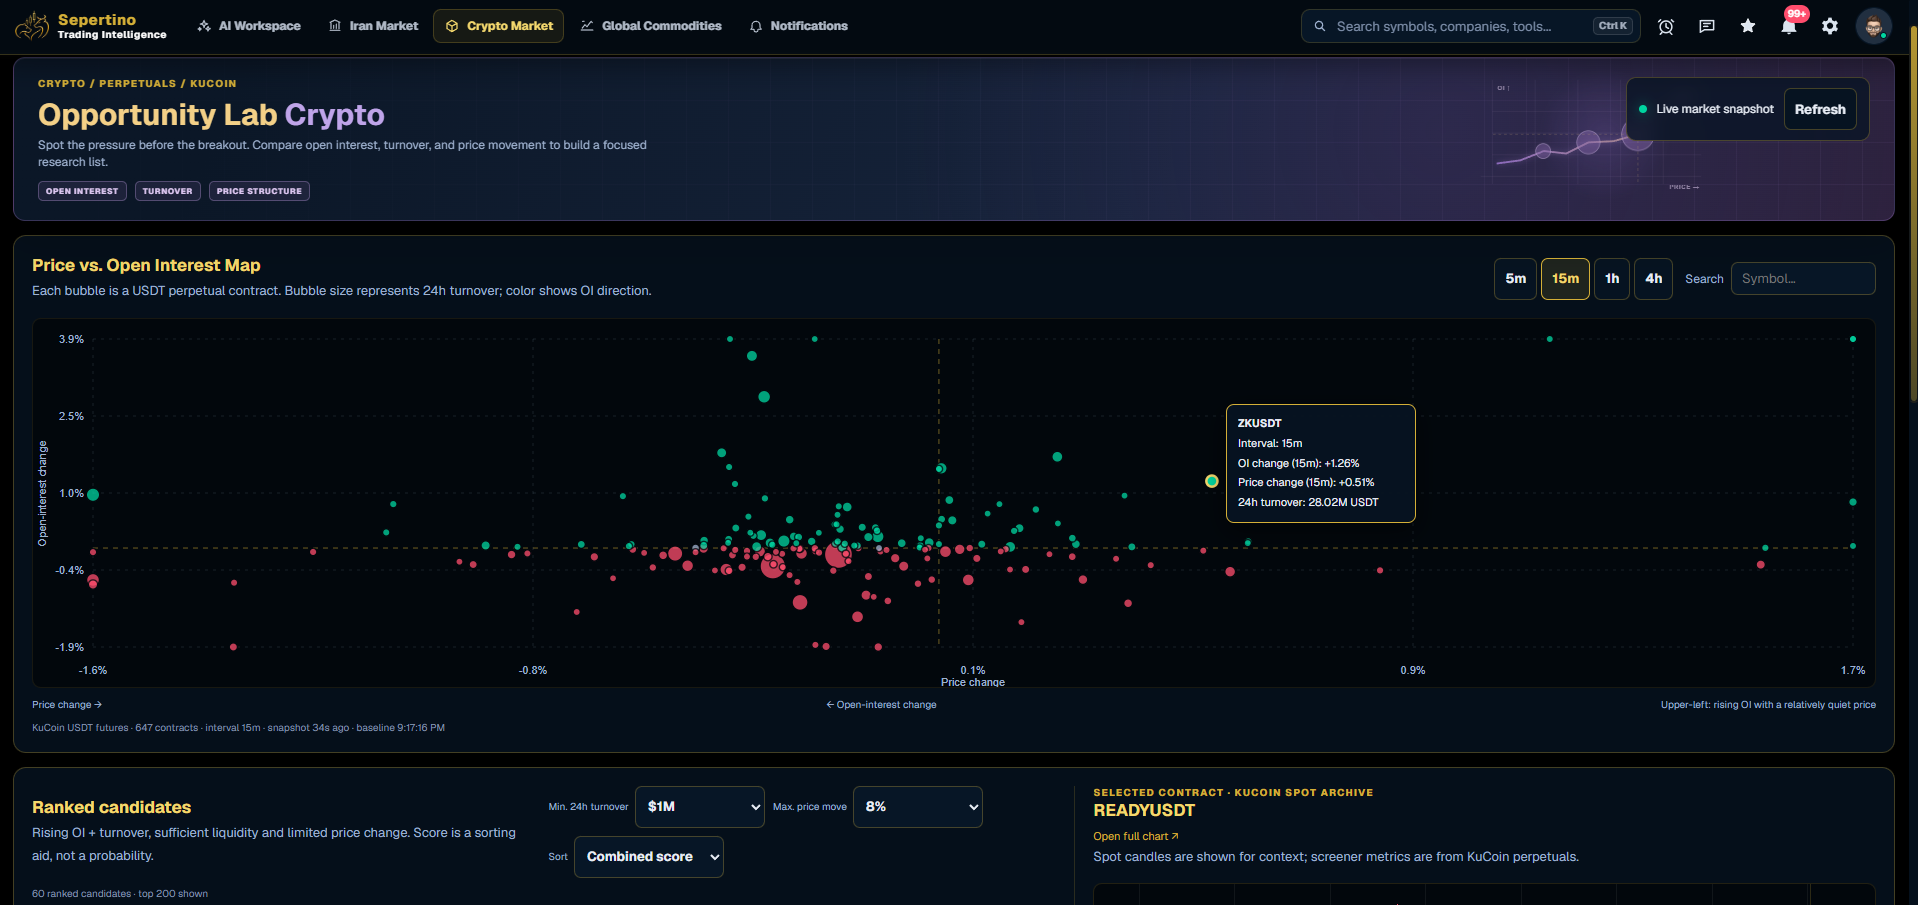
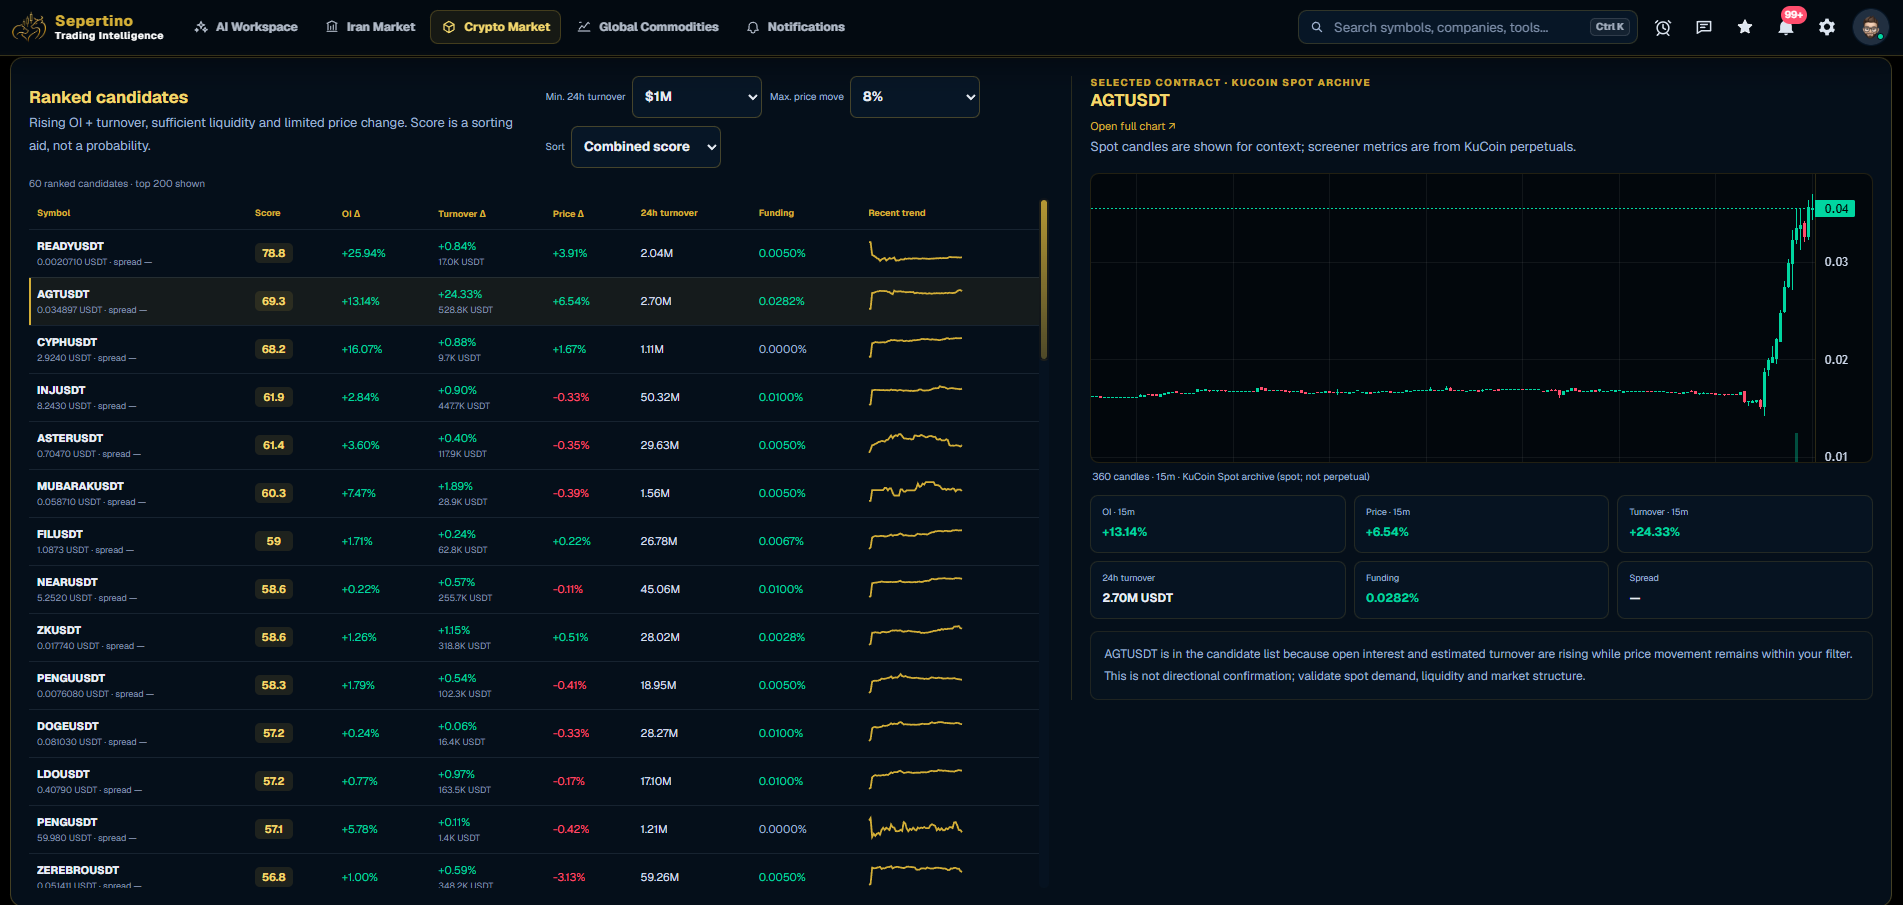
Look for unusual pressure before a possible expansion. The price versus open-interest map plots contracts by recent movement; bubble size reflects 24-hour turnover and color shows open-interest direction. It is a way to focus research, not a prediction.
A connected workflow
Move from broad-market context to a ranked shortlist and then into detailed charts without losing the reason a symbol caught your attention.
Use high-level market dashboards and visual maps to identify where activity is concentrated before opening individual assets.
Matched filters and supporting metrics explain why a symbol appears, making the shortlist easier to audit and compare.
Open charts, save to watchlists, and create alerts directly from the same result that surfaced the opportunity.
Sepertino Trading Intelligence
Ready to explore the terminal? Create your account or sign in to continue.